Business Sectors
Contents
Top 10 US ports buoyed by import volumes from China
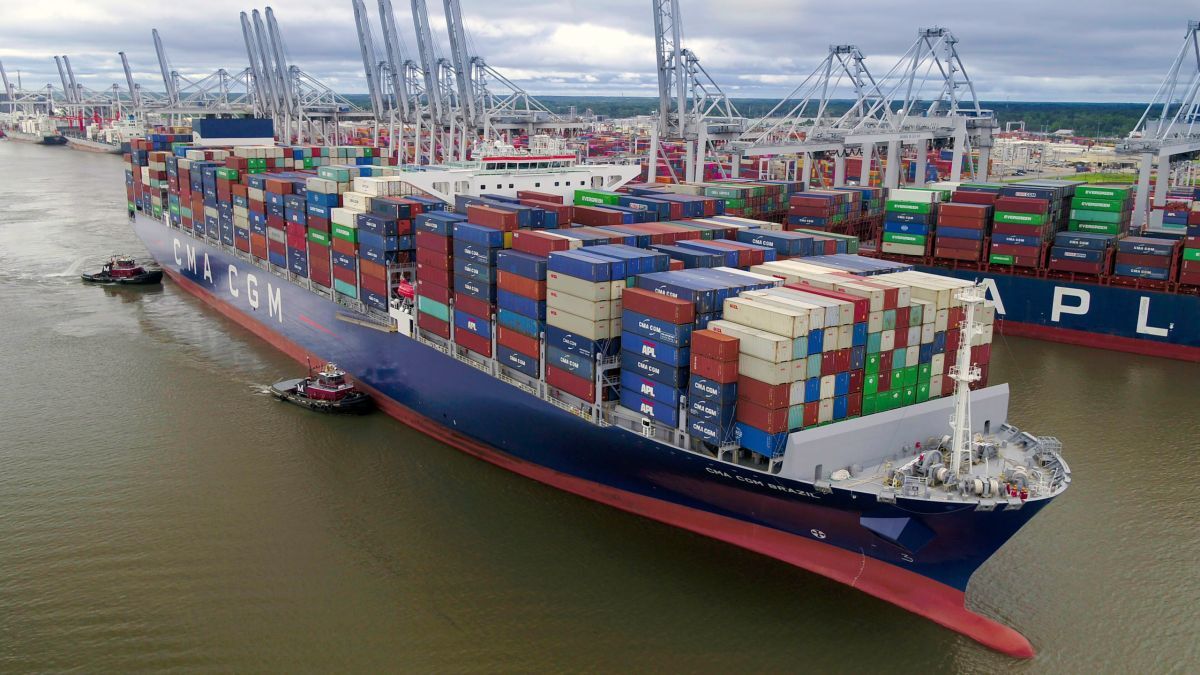
Driven by surging imports from China, the top 10 US ports showed a positive annual growth in volumes in 2020, with record numbers of container ships waiting at anchor to unload in Los Angeles and Long Beach
Container imports into the 10 largest US ports were up 23.4% year-on-year in December 2020, following significant increases in November of 25.1% and October, 18.1%.
The last time this level of year-on-year gains in inbound containers was seen was more than 10 years ago, after the recovery from the financial crisis. It continues to be driven by increased imports from China.
The December 2020 comparison benefited from a weak December 2019 that declined 12.5%. The catalyst of Q4 volume declines totalling 9.0% in 2020 was the impact of US tariffs on most loads imported from China. Then, as now, those tariffs are at 91% of their peak level.
With the strong December rebound, 2020 closed out with a 2.3% gain, which would have been unthinkable at the outset of the coronavirus pandemic in March. It was a reversal of the 0.9% overall decrease in 2019. The two clear catalysts that have impacted inbound volumes these last two years are the successive effects of the China tariffs and the pandemic.
In the two proceeding years of 2017 and 2018, the average annual volume growth rate was 7%. That could be pegged as the underlying growth clip that may have continued in the absence of those negative catalysts – China tariffs and Covd-19 – given the continuing US economic strength. Framed that way, it is one method to measure their respective impacts.
That framework suggests the China tariffs took out what would have been 8% more volume in 2019 and Covid took out what would have been 5% more volume in 2020. While both are one-time adjustments for those years that we could expect to come back in as the catalysts unwind, the latest data suggests noteworthy reversals of the impacts, particularly related to tariffs, even with the initial negative catalysts in place.
The actual three-month trailing numbers are now up 22.1% with the six-month figures up 13.9% and 12-month trailing numbers up 2.3%. The three-month trend line figure is the highest it has been in decades.
Activity at US ports
In December, US east and Gulf coast port volumes increased 24.9%, versus a 25.7% increase in November; while US west coast ports increased 22.1%, versus a 24.6% increase in November. Some 43% of total inbound loads into the US originated in China, with west coast ports having an even higher concentration of such loads.
Ports with the strongest December performance were Savannah, Georgia (up 36.6%), Houston (up 26.4%) and Long Beach, California (up 25.6%).
The weakest performance during the month was at Oakland (up 11.0%), Charleston (up 14.4%) and Seattle/Tacoma (up 15.7%). Los Angeles and Long Beach were the most adversely impacted ports at the beginning of the pandemic and their recent strength includes catch-up from sailings cancelled in the year. These recent volume surges have resulted in terminal capacity limits in part attributable to labour constraints related to the pandemic. As of late January, for example, this resulted in some 32 container ships anchoring, awaiting berths off Los Angeles and Long Beach.
The pattern of recent volume surges being catch-ups of earlier declines at the beginning of the health crisis played out in all ports to one extent or another. Seattle/Tacoma has not recovered to the same extent and more than any other US west coast port, it has been adversely affected by the coastal shift resulting from larger container ships that can now call on US east coast ports through the expanded Panama Canal.
Table 1- Import container volume, Top 10 US ports
| Port | Dec 2020 TEU | Dec % change | 3 mo TEU | 3 m % change | 12 m % change |
| Los Angeles | 460,865 | 23.4% | 1,432,298 | 25.9% | 2.4% |
| Long Beach | 406,072 | 25.6% | 1,191,157 | 24.9% | 6.4% |
| New York | 354,295 | 22.6% | 1,140,310 | 22.7% | 3.8% |
| Savannah | 235,165 | 36.6% | 702,963 | 28.9% | 4.4% |
| Houston | 126,771 | 26.4% | 384,202 | 23.1% | 4.0% |
| Norfolk | 123,218 | 18.8% | 380,202 | 14.8% | -3.9% |
| Seattle/Tacoma | 122,469 | 15.7% | 354,189 | 14.2% | -8.4% |
| Charleston | 93,568 | 14.4% | 283,500 | 9.1% | -3.1% |
| Oakland | 90,220 | 11.0% | 255,018 | 7.5% | 2.1% |
| Total - Top 10 ports | 2,012,643 | 23.5% | 6,123,839 | 22.1% | 2.3% |
Table 1, ‘Top 10 US ports by imported container volume’, shows volumes for the three months ending December, along with year-on-year percentage changes for the latest month, three-month and 12-month periods. Seattle/Tacoma volume is combined, but available historical data confirms that each is among the top 10 US ports.
For the three months ending December, US east and Gulf coast ports increased 21.6% compared to a 22.5% gain at west coast ports. Best performers over the last three months were Savannah (up 28.9%) and Los Angeles (up 25.9%). Oakland (up 7.5%) and Charleston (up 9.1%) were the worst performers.
Over the last 12 months, the best port performers were Long Beach (up 6.4%) and Houston (up 4.0%), with the worst performers Seattle/Tacoma (down 8.4%) and Norfolk (down 3.9%).
Changes in consumer purchases
In category after category, there were sharp spikes bringing volumes into positive territory for 2020. The data points to much of this being catch-up from earlier volume decreases. Some categories, however, are now showing meaningful growth for 2020 based on consumer purchases driven by the pandemic’s stay-at-home lifestyle.
Shipments of furniture, sporting goods and toys fit that description. Changes in consumer purchasing habits, with geometrically more online shopping and the related changes in supply chains and inventory levels are undoubtedly also having impacts.
As a measure of underlying economic activity, typically inbound and outbound container volumes move in similar directions. However, that is currently not the case. Outbound container volumes declined 2.8% in December, the 10th straight monthly drop. The imbalance gap is near a historical high with the ratio inbound loads to outbound loads at 2.36x in December.
By contrast, the annual ratios were 2.19x, 1.85x, 1.87x, 1.80x and 1.71x for 2020, 2019, 2018, 2017 and 2016, respectively. The divergence in these two measures and the growing gap is evident in Table 2.
Table 2 - Import and export levels at US ports
| Period | % change in imports | % change in exports | Difference |
| December 2020 | 23.4% | -2.8% | -26.2% |
| 3 months ending December | 22.1% | -3.7% | -25.8% |
| 6 months ending December | 13.9% | -5.4% | -19.3% |
| 12 months ending December | 2.3% | -5.7% | -8.0% |
The annual ratio of outbound loads has grown consistently in recent years. After increasing 8% from 2016 to 2019, it has grown another 18% in the latest annual period, giving a seven-fold annual increase.
As of July 2020, import container volumes were down 10% year-on-year and as of December 2020 they were up over 20%. By contrast, export container volumes were down below 10% in July 2020 and have remained below positive territory, down almost 5% as of December 2020.
While the inbound and outbound container volumes have not moved in lockstep, for much of the time they were broadly trending in the same direction with plausible reasons to explain the differences. The latest data, however, shows US import gains of 20% while US exports are down almost 20% – a striking difference.
Possible drivers of this divergence include shortages of containers in Asia, differences in catch-up from earlier periods, differences in economic activity and the diverging impact of the pandemic and tariffs.
With eastbound headhaul rates more than five times westbound rates, the carriers are less interested in typing up equipment for these backhauls that can add considerable days at each end, effectively reducing throughput capacity. Moving the container back empty is therefore often in their best financial interest.
Looking at the monthly data, export volumes began trending down in earnest in early 2020 before the spike in inbound volumes and tight equipment availability. However, it does not look like a major contributor to the current gap. Differences in catch-up needed or underlying economic activity also do not appear to be major explanations of the divergence.
The difference in demand for the type of goods moved inbound versus outbound, with the heavy reliance on consumer purchases, is part of the gap and no consumer market is bigger than the US. With that, and widely reported changes in consumer purchasing patterns as funds that were spent on restaurants, holidays and entertainment are channelled into tangible products, it may be a noteworthy part of the gap.
The final factor, that tariffs are hurting container exports more than they are hurting container imports, could be the most pronounced factor as that conclusion is supported by the level and trends in actual data.
These sharp spikes in inbound volumes these last few months are increasingly bringing dislocations and problems as capacity limits are reached in various parts of the system. This is particularly the case at terminals in Los Angeles and Long Beach as evident by the record number of container ships now at anchor awaiting berths.
This capacity situation wreaks havoc throughout the supply chain as something akin to gridlock occurs when there is stoppage at a key node. Terminals reaching capacity limits result in ships waiting unproductively at anchor or being diverted to other terminals. Both have the effect of reducing vessel capacity, which exacerbates the situation more.
Schedule changes and diversions have containers ending up at different places and at different times. This adds to the stress on terminal capacity and that in turn slows down pickup and delivery operations.
Compare it to what occurs in midtown Manhattan when cars get stuck at an intersection; movement slows until the blockage is dealt with. The network effects that occur when container shipping systems reach capacity are widespread and result in dissatisfaction by all parties involved. Some of the capacity issues at terminals resulted from labour constraints due to the pandemic and those will prove to be temporary.
Chinese New Year slowdown?
The Chinese New Year and the slower period that typically follows the two-week plant shutdown accompanying the holiday will be an opportunity to clear the backlog and get all the parts of the integrated transport systems that is container shipping working smoothly and together again.
If upon reviewing this unusual period, ports recognise they have bottlenecks that constrain what their capacity could otherwise be, they would be wise to consider making investments to improve the situation. The return on investment of port-related infrastructure expenditure has historically been relatively high.
US$1Tn of goods moved
In 2020, more than US$1Tn worth of goods in containers moved across the top 10 ports in the US. Increases or decreases in the overall volume of more than 30M TEU have pronounced direct and knock-on economic impacts to commerce in the region, and the US as a whole.
Container ships are the main artery for America’s trade with other countries. When you broaden the scale and look worldwide, shipping plays an even more critical role.
Excluding the 15% of international trade that moves by land modes, almost all in North America and Europe, trade moves by water or air. In terms of cargo weight, ships move 99.56% compared to air moving just 0.44%. If the breakdown is based on value, it shifts slightly, but cargo moving by air is still a low single-digit percentage of the total. In other words, the cost efficiency of shipping enables world trade.
Related to this Story
Events
Maritime & Offshore Community Golf Day 2025
Offshore Wind Webinar Week
Maritime Decarbonisation, Europe: Conference, Awards & Exhibition 2025
Offshore Support Journal Conference, Americas 2025
© 2024 Riviera Maritime Media Ltd.


