Business Sectors
Events
Contents
New tool to analyse container ship tonne-mile demand
Container Shipping & Trade has been given exclusive access to VesselsValue’s development of a tonne-mile demand tool for the container ship trade
Container Shipping & Trade has been given exclusive access to VesselsValue’s development of a tonne-mile demand tool for the container ship trade
Shipping data providers VesselsValue is well-known for providing instant valuations on container ships. Perhaps not so well-known, at least in container shipping circles, is its data on shipping trades. Container Shipping & Trade was given a sneak preview of VesselsValue’s latest product*: a container ship version of the established wet and dry bulk trade analysis tool – VV Trade.
“Our clients are banks and shipowners who need to have an instant opinion on a ship’s value. They asked us to use our AIS data to provide wet and dry bulk trade lane analysis as part of their investment analysis,” said VesselsValue senior analyst Court Smith.
Analysing a sector’s aggregate shipping movements is an investment decision tool. The problem lies in the nature of AIS data.
“As many people will be aware, the AIS data broadcast by vessels can be tricky to analyse in raw form. There are multiple spellings of the same port name and changes in draft are often reported late,” said Mr Smith.
VesselsValue has invested considerable resources in cleaning up the raw AIS data using a combination of algorithms and human experience. The algorithms that produce the trade data also incorporate an element of behaviour prediction. It scores the previous voyages and calculates the vector. If a vessel is consistently sailing on a certain route, but the AIS data is late or showing an out of parameter destination, the programme reverts to the likeliest destination.
This is one of the key features behind the new container ship movements trade module. It can show the latest aggregate movements and tonne-mile demand in a current time period with a high degree of certainty.
The main question is: if the trade module is showing movements at a fleet or individual container ship level, can it show TEU movements?
“At the moment it is not possible to accurately measure TEU movements using changes in the AIS draft. We assume each container ship is full and analyse at the deadweight level,” said Mr Smith.
This is understandable. In theory, one could nominate a weight for each TEU on the ship, and then calculate the change in the number of TEU on board from the change in draft but this would give no information about the number of boxes loaded or discharged.
“From an investment point of view, our clients require data that answers the bigger questions such as: is this the right sector to invest in? Analysing aggregate movement data over time shows the growth and the changes in trade direction,” said Mr Smith.
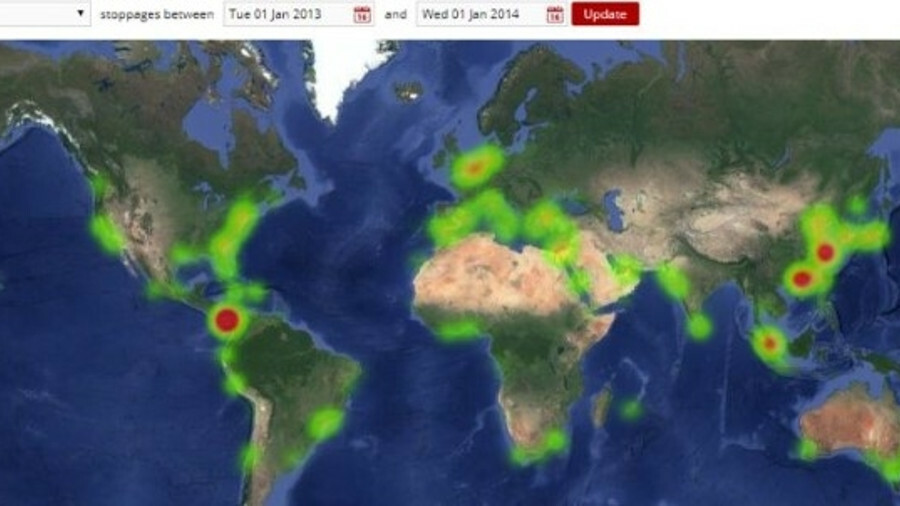
This is illustrated by the changes the Panamax container ship fleet has undergone in the last five years. The expansion of the locks in the Panama Canal in June 2016 would logically be the end of the traditional-sized Panamax container ship. As the image of the Panamax container ship heatmap shows, in 2013 this size of container ship was the workhorse of the fleet.
Unsurprisingly, the heatmap glows red around the Panama Canal itself, indicating the high concentration of Panamax tonnage in the region. Post-expansion, it was widely assumed the Panamax container ship trades would disappear.
However, the latest Panamax heatmap shows a concentration of Panamax container ships in West Africa and southeast Asia. Far from disappearing under the onslaught of Neo-Panamax container ships, the Panamax container ship continues to flourish in niche trades, and actually could be a cunning short-term investment (see “Container ship values today and tomorrow” below).
As mentioned above, the container ship module of VV trade is still under development by VesselsValue. One very interesting analysis that can be wrought from the data will be schedule reliability. Of course, VesselsValue would hardly be the first company to offer such a product with SeaIntel and Alphaliner (to name a few) already established in this field.
In theory, using this tool it will be possible to compare the service reliability of liner services against the published schedules. It could show the number of late journeys into a port.
Even without the published schedules, there is a rich seam of data to be mined. For instance, VesselsValue claims to be able to alter the geo-fence at a terminal level, which would reveal the throughput on a like-for-like vessel basis.
“The level of visibility could be the next stage – if there is the demand from clients,” said Mr Smith. The development would require gathering data from all the liner services and assignment into the various alliances, too.
As a fore-taste, VesselsValue produced the table above based on the container ship trade showing the 10 top ports ranked by ULCV movements with Singapore overtaking Yangshan in the last 12 months. Of course, such rankings are highly controversial, as Mr Smith acknowledged. “We are still playing around with the data but by using the fully-laden dwt technique, we can give an accurate indication of aggregate tonne-mile demand on a given route port-to-port or region-to-region,” he said.
However, it is the context of its other services that makes the VesselsValue trade product unique. Coupling the tonne-mile performance of a vessel to its value produces a new investment analytic. In theory, an investor is looking for an asset that is in regular employment and working at a level at least equivalent to the peer group or higher.
Speed is another metric that is discoverable in the new container ship trade tool. A small increase in average speed in a sector is an indicator that demand is growing. But is this demand growth just a seasonal adjustment or a genuine step-change? An analysis of the average speed over time using the VV trade container ship tool will parse the seasonality in the data.
*Given the potential of the new container trade product, VesselsValue is keen to have input from the readers of Container Shipping & Trade. Send your suggestions to Rebecca.moore@rivieramm.com.
Container ship values today and tomorrow
Behind the new container ship trade tool is the original purpose behind VesselsValue – to provide instant values on a wide range of vessels.
The banking and finance community have demanded that this be extended to expectations of values in the future. VesselsValue has partnered with Oslo-based advisory firm ViaMar to provide projections of market values for individual vessels in the container sector and also dry bulk carriers, tankers and the LPG fleet.
In a recent analysis, VesselsValue senior analyst Court Smith noted that “The outlook for shipping asset prices remains bright, but several areas are more attractive than others.”
He highlighted two container ships sectors. The value of a 10-year-old 4,250-TEU Panamax container ship is set to rise to by 50% between Q1 2019 and Q1 2020 and represents the strongest buying opportunity in the current outlook of any shipping sector.
Over the same period, the value of 20-year-old, 1,750-TEU Feedermax container ships are projected to increase by 32%. Given that values in this sector are currently in the region of US$2.75M (the 1999-built, 1000-TEU Munich Trader was sold in early January 2019 for US$2.5M), the low level of investment required represents a relatively small risk/high return for the more speculative shipping investor.
Related to this Story
Events
Maritime Environmental Protection Webinar Week
Cyber & Vessel Security Webinar Week
The illusion of safety: what we're getting wrong about crews, tech, and fatigue
Responsible Ship Recycling Forum 2025
© 2024 Riviera Maritime Media Ltd.
